HYROX pace calculator
Drag each split to your target and watch the finish time add up. Every curve shows how athletes in your division actually finished that split.
Total time
1:27:44
top 47.6% of finishers
Run pace
Average per 1 km run
5:14 /km
top 49.8%
SkiErg
4:36
top 49.5%
Sled Push
3:09
top 49.8%
Sled Pull
5:02
top 50.0%
Burpee Broad Jumps
5:39
top 49.9%
Row
4:55
top 49.4%
Farmers Carry
2:13
top 50.3%
Sandbag Lunges
5:24
top 49.9%
Wall Balls
7:17
top 50.0%
Roxzone
All transitions
7:37
top 50.1%
Where the curves come from
Each curve is built from 759,659 official results across 124 HYROX races in seasons 8 and 9. The higher the curve, the more athletes finished in that time.
The percentage under each time is the share of the division that was faster. Top 25% means three quarters of the field took longer.
Run pace is your average over the 8 runs, and Roxzone adds up every transition. Few athletes sit at the same level on every station, so a real race can finish a little away from the total.
Finish times by level
Times that separate each level in Open Men. Each column is ranked on its own, so the splits in a row do not add up to the finish time.
| Level | Finish | Run pace | Stations | Roxzone |
|---|---|---|---|---|
| Top 10% | 1:10:43 | 4:11 /km | 30:23 | 4:58 |
| Top 25% | 1:18:13 | 4:38 /km | 33:49 | 6:01 |
| Top 50% | 1:28:46 | 5:14 /km | 38:42 | 7:37 |
| Top 75% | 1:43:01 | 6:02 /km | 45:16 | 9:54 |
| Top 90% | 2:00:21 | 7:04 /km | 53:18 | 12:32 |
Pacing questions
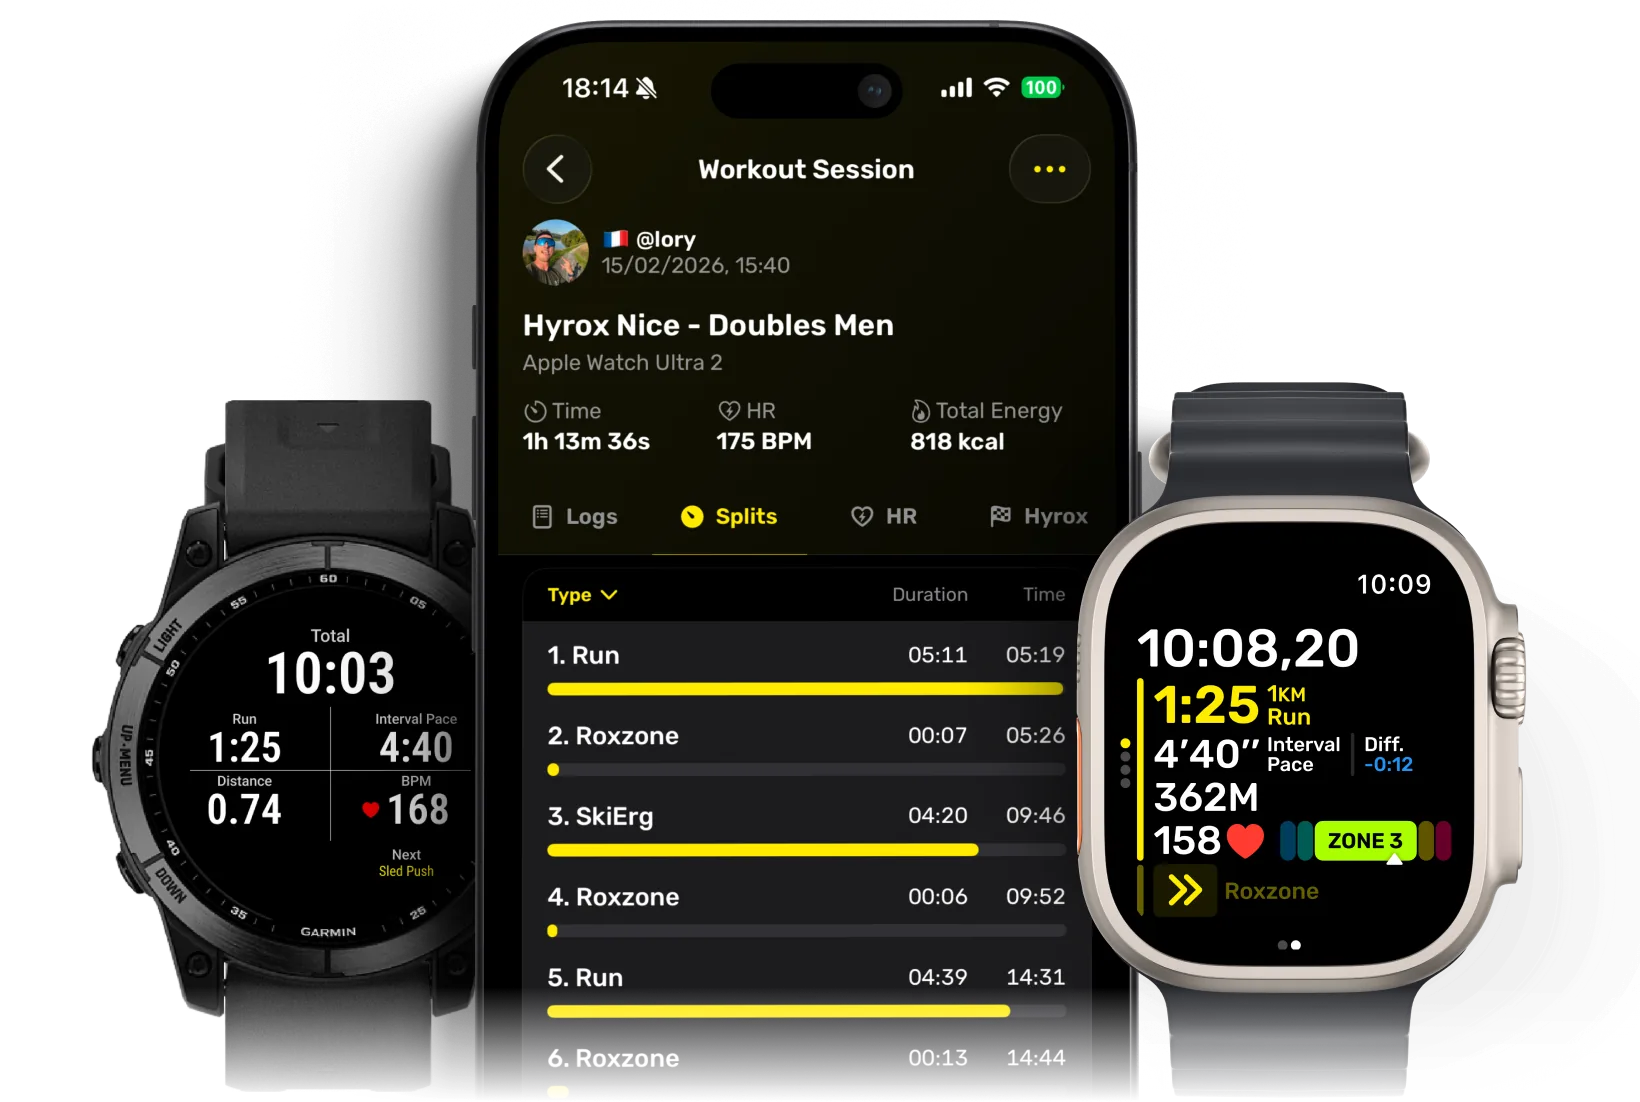
Hyro records every run, station and Roxzone split on Apple Watch and Garmin, so you can check your race against this plan.